Canvas Timeline Charts
Canvas Timeline Charts give you a high-level view of the initiatives and content your teams are working on. These Gantt-style charts show you your planned, in-progress, and completed initiatives and the content within them.
How It Helps
Use timeline charts to plan your content with full visibility into the current content that makes up your initiatives, with the most important dates exposed to plan against before you even begin executing content. Spot bottlenecks and evaluate resources so your plans aren’t disrupted.
Best Practices
- Initiatives are the foundation for Canvas: Canvas is most powerful when your initiatives represent your strategy and contain the content to execute it. Group the initiatives in your timeline charts by their metadata, such as initiative type, owner, or region, to plan with these details front and center.
- Manage access in canvas at the plan level to ensure that only the correct team members and stakeholders see the plan, and the charts within it.
- As your campaigns are executed, reference your timeline charts to track a dynamic view of your initiatives and their content and ensure they are on track to meet deadlines.
- Expose custom field dates, event dates, and task dates on your timelines to see important dates that let you orchestrate the timing marketing activities, anticipate resource requirements, and understand dependencies.
- Leverage shared tasks for the most powerful use of task dates. These are the tasks that are set up in your settings and included with the same task name in workflows across content types. This unlocks full functionality for tasks in Canvas as well as Insights, the calendar, and your catalogs.
Creating a timeline chart
To create a new matrix chart in canvas, start by either creating a new plan or jump into an existing plan on your dashboard.
To set up a timeline chart:
-
Click the Select a Chart Template button.

-
Click See Example to see an example of the available template. This template generates a timeline chart that includes all your active initiatives for the year.
-
Click Create Chart if you want to proceed with the template.
Note: If you decide on a custom matrix, click outside the preview pane to close the example and click the Timeline custom chart option.
-
Rename the title as required. The maximum length of the title is 64 characters.
To learn more about the title when you duplicate the chart, refer to Duplicating Canvas.
After creating your chart, it is displayed in edit mode. See Managing and Editing Timeline Charts for help with understanding your configuration options.
Viewing a timeline chart
In a timeline's view mode you can do the following:
View initiative details and content dates
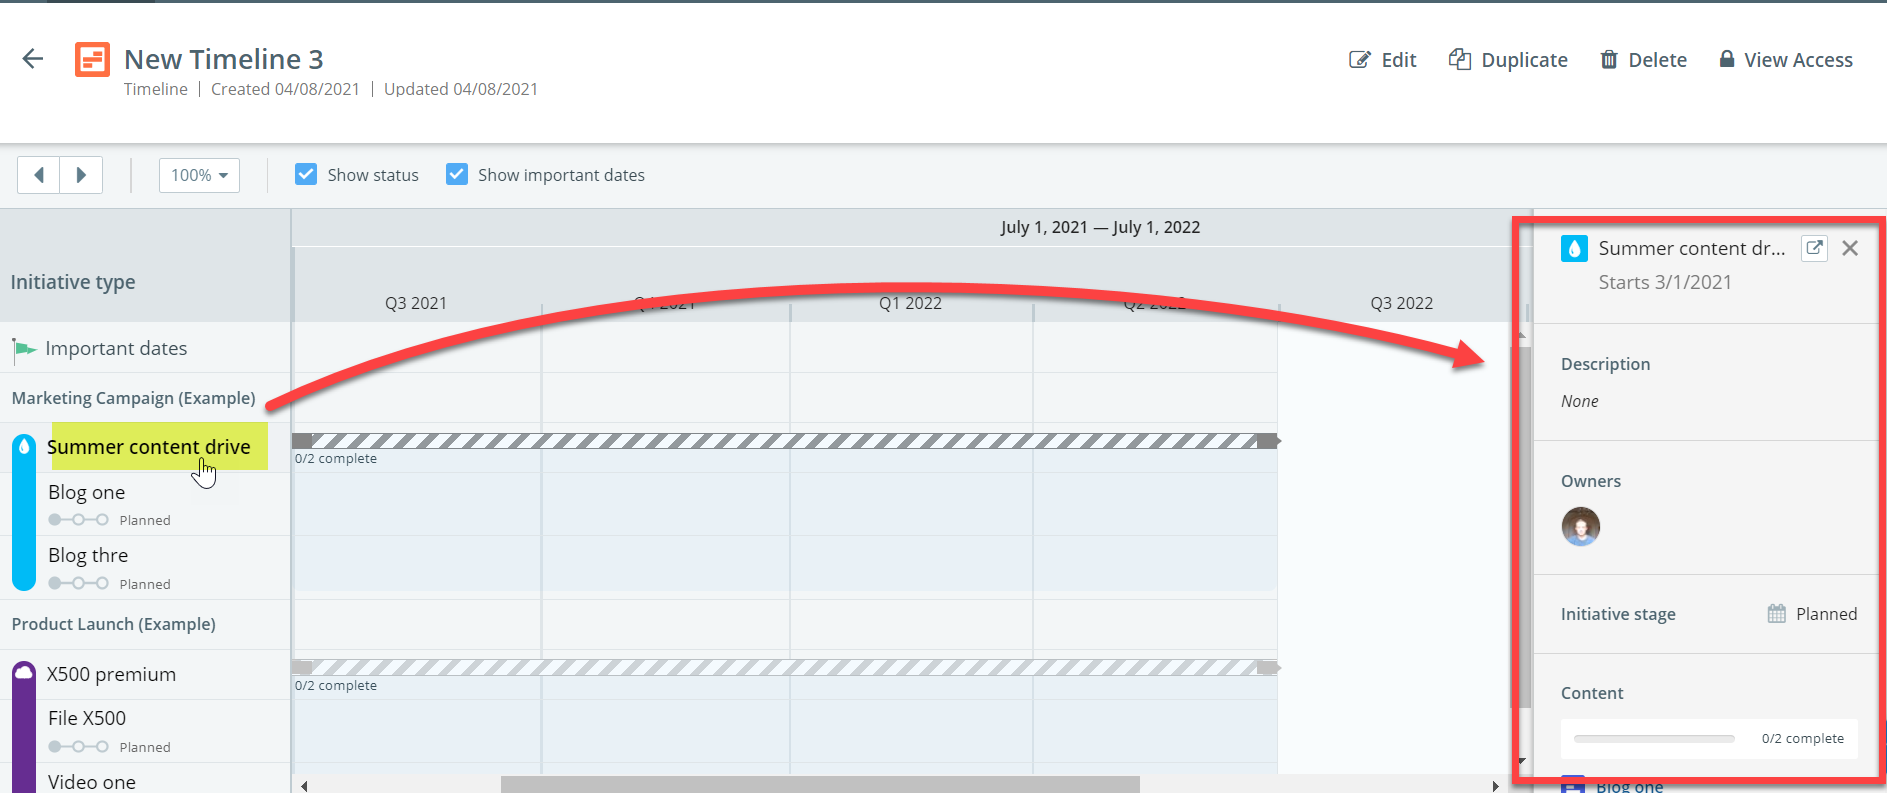
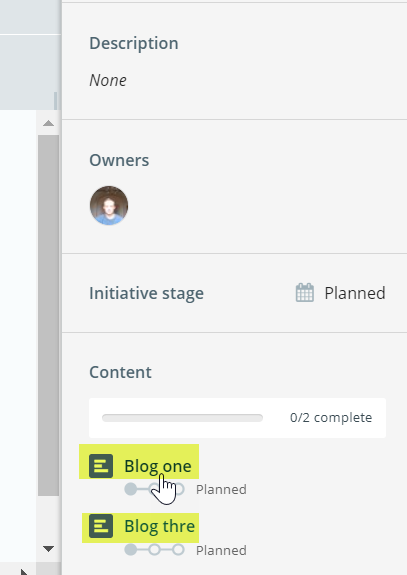
To view an initiative’s details in a panel on the right side of the chart, click on the initiatives listed at the left (y-axis) of the chart. This panel will show you the initiative’s description, owner(s), stage, and the status of content in the initiative.
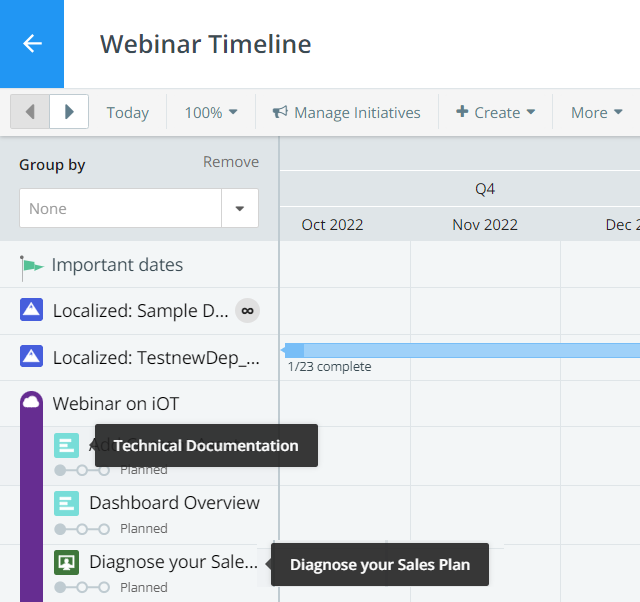
The content associated with the initiative is also displayed in the left-hand panel. Here, you can view the title of the content and the content type icon is displayed next to the title which displays the content type name when you hover over the icon.
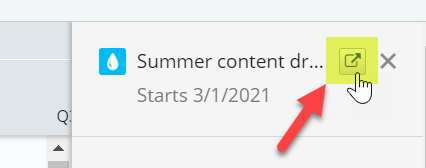
You can open a new browser tab that displays the initiative screen in studio by clicking the icon indicated below.
In addition, content dates associated with the initiative are displayed. Hover over a date for details. The following types of date may be displayed:
-
Event dates are the start and end dates on an event content type within an initiative. These dates appear as grey diamonds.
-
Task dates are the workflow deadlines on content. These dates appear as grey (incomplete), green (completed), and red (incomplete and overdue) circles.
-
Custom field dates are dates from a custom field (not in a workflow task) on content. These dates appear as grey squares on your timeline charts.
Access content in studio
Click on content titles in this panel to open a new browser tab for that content in Studio.
Adjust the chart view
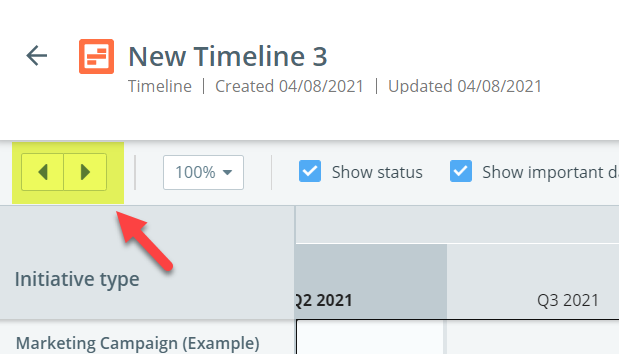
Scroll your view of your timeline chart manually or by using the arrows at the top left of your chart (indicated below).
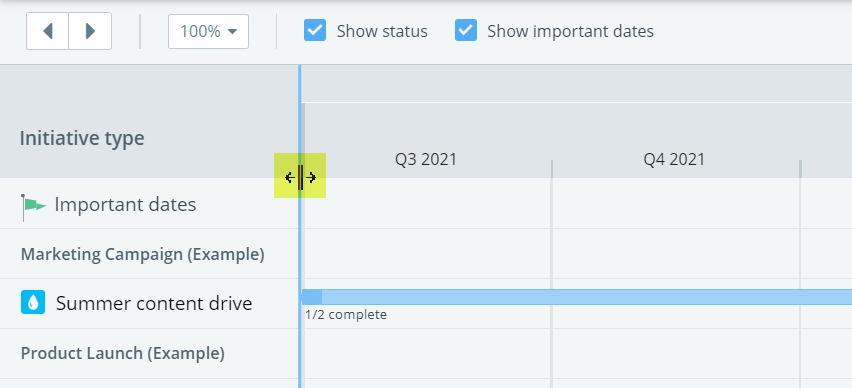
Expand the left-hand panel if required by dragging its border to the right.
View important dates
Click on Important dates at the top of your listed initiatives on the left to see details about these dates in the right panel of your screen.
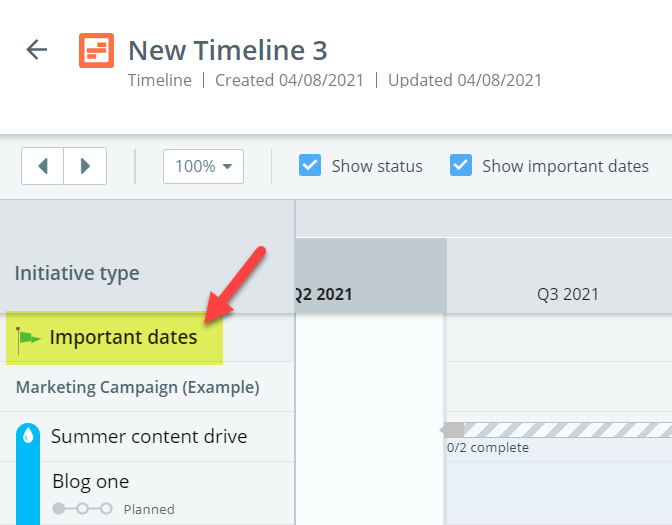
Important dates appear as flags on the chart. Click on a flag for further details about the specific date.
Enable/disable initiative status and important dates
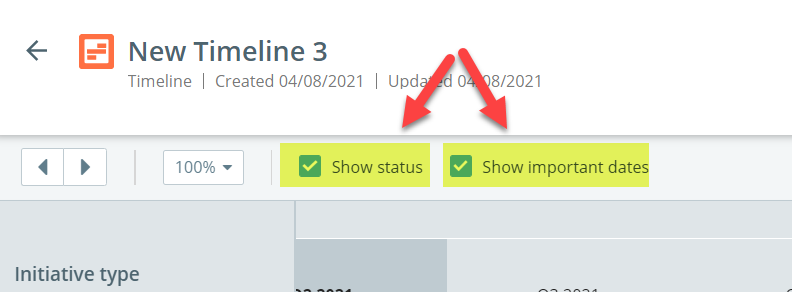
Toggle on and off important dates and status by clicking the respective buttons on the top toolbar (Show status and Show important dates).
